Whiteboards, moodboards - let's discuss and gather ideas

whiteboards are on the long-term roadmap of Logseq, let’s discuss and share ideas to help the devs build the best whiteboard experience !

what are whiteboards ?

placeholder until we have better definition…
a whiteboard is usually a canvas in which a user can freely arrange notes and documents spatially, creating ‘maps’ or ‘islands’ of notes. This is great for visual thinkers and adepts of mind palaces, and more generally a great tool to collaborate and organize thoughts.

related concepts: mind maps, concept maps, moodboards, mind palace/mental palace.

reply format

(this is just a suggestion, feel free to re-arrange, add or remove bullets):

### use-case : 
describe why you need  whiteboards / how you use them
### most wanted features : 
what do you need ?
### experience with whiteboards: 
what other whiteboard/mindmap programs have you used before, describe their strengths or how they could be improved
### questions / random thoughts : 
anything else 

when comparing existing implementations, let’s try to keep it civil, avoid trash-talking or giving bad reps to other programs.

Common and appreciated things

  1. Tools that focus strictly on connecting text or images. Diagraming is NOT drawing, the tools listed below serve only the purpose of connecting thoughts only.
  2. Tools that try to serve both use-cases do a poor job at serving any use-case
  3. Tools that afford friction-less item/element creation—double-clicking on the canvas creates the next thought.
  4. When connections can be made fast. The purpose of diagraming is to show connections, so it shouldn’t be overlooked.
  5. When the user doesn’t have to spend time resizing elements—boxes should have auto-layout. Nothing ruins flow more than adjusting the size of things to look right.

Things to consider

  1. Consider making the connections in a diagram real.
  • Maybe a dashed line represents a block reference of a parent and a solid connection line takes the form of a parent-child relationship?
  1. Avoid allowing for too much customization.
  • There should be set shapes with maybe the option to adjust the background color.
  • Too many options will take away from the real work of connecting thoughts.
  1. Share-ability
  • How should a diagram be exported so it can have an audience? Almost all diagrams will need to be shared, so support for something like a PNG export should be first-party (you can only survive on screenshots for so long :slight_smile: )

Where I take inspiration

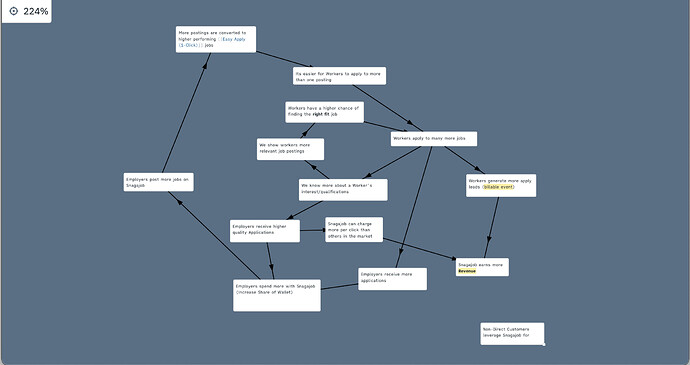
Roam Diagrams

What they do well
  • The diagrams were integrated into the actual graph, not an external tool that is embedded (unlike excalidraw).
  • Diagram elements are actual blocks—the tool is not a closed system—it interacts with the graph and generates bullets
  • Element creation is simple. Just double click anywhere on the canvas and a new block was added.
  • The canvas was infinite.
  • It supports block references
  • Drag and drop connections felt seamless.
Where the tool is lacking
  • There wasn’t a true parent-child relationship between connected elements. The output was just a list of blocks behind the scenes
  • Only one card style (just a white rectangle card). I would like the ability to change the background color.
  • VERY buggy—I don’t think they ever moved past the first version of the implementation. It felt like it was a personal hack day project of Conor.
  1. Connection arrows wouldn’t render correctly
  2. selecting multiple elements doesn’t function well
  3. Pasted images wouldn’t scale to fit
  4. No support for connection line text
  5. Limited to only one type of connection line (solid arrow)
  6. No auto-layout for block cards

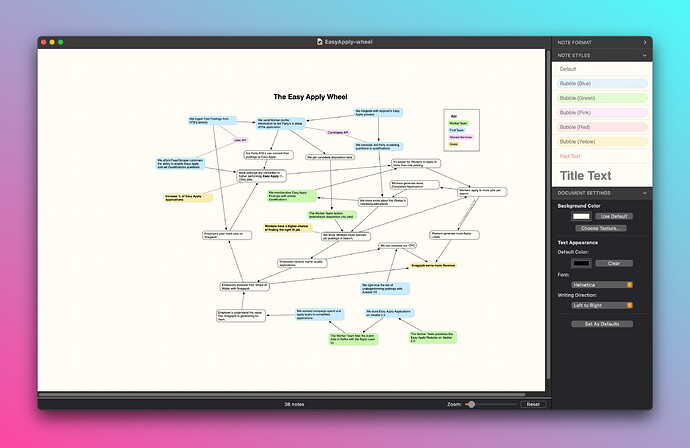
Scapple

What they do well
  • Frictionless element creation—just double click to create a new item. It would be great if they allowed you to set the default style that is set on a double click.
  • Connections on drag and drop
  • Also supports a dashed arrow type allowing for a difference of association.
  • Allows users to set style patterns for a workspace
Where the tool is lacking
  • No way to curve a line around an element.
  • Connect line text is available, but implementation is poor. (It is almost like a setting menu). This is one of the biggest pieces of friction with the tool.
  • Almost no viable way to export files. Only support for a unique file type—the share-ability is limited to taking screenshots of your diagrams.
6 Likes

most wanted features :

I hope there is whiteboard function like scapple

  • free placement of card
  • free connection of card (dragging card into another)
  • the card should be a normal block that contains link and child blocks
    so that it can interact with the rest of logseq (embed, refrence)

implemention suggestion :

the simplest way of implemention I can think of is a speical parent block with many child normal blocks which has postion and link properties
we can just use block id as the link infomation

  • [[whiteboard]]
    • card1
      id:: AAA
      position:: 121 + 21
      link:: BBB + CCC
      • card2 is just normal card
    • card2
      id:: BBB
      position:: 151 + 24
      link:: CCC
    • card3
      id:: CCC
      position:: 22 + 189
      link:: AAA
1 Like

Lets start with some thoughts about “powerful whiteboards vs. a logseq whiteboard”

  • Is the goal to integrate a whiteboard with full functionality into Logseq? I think that would make little sense. There are quite a few whiteboards out there. Really comprehensive ones like my favourite “Mural” (I was the one who evaluated suitable whiteboard collaboration tools for our company and my choice was Mural) but also simpler and free offerings.

  • However, a whiteboard provided only half-heartedly in Logseq also makes little sense.

  • :fire: The key question for me would be: "In which usecases does a whiteboard integrated into Logseq make sense?"

  • In other words: When would I use a whiteboard in Logseq if I could also use a Mural board (or one of the other free whiteboards such as https://www.whiteboard.team/ or those that are integrated into Videocall-Tools)?

  • :bulb: For me, the answer would be: “Mainly to sort out thoughts I might have collected in an outline. In a whiteboard, you are pretty much unrestricted and can freely arrange and group your cards/thoughts.” (You are not even bound to the hierarchy of outlines or mindmaps)

  • In turn, I would not expect to find features in a logseq-whiteboard that would allow me to use a “magic estimation board” for doing collaboration estimations in a scrum team. The energy for such extensive features would probably be better spent elsewhere in Logseq.

That said - here is my input …

use-case :

describe why you need whiteboards / how you use them

  • (1) collect ideas (e.g.: take screenshots during a presentation and write notes next to them)
  • (2) sort out one’s own thoughts (write down some ideas - rearrange them - group them)
  • (3) presentations (jump to different predefined areas / but also be able to show the big picture; similar to something like prezi)
  • (4) collaborate with others (brainstorming, Scrumboard, Magic-Estimation board, …)

most wanted features :

what do you need ?

  • when collecting ideas, everything must go quickly and smoothly
    • the thoughts flow and the information has to be quickly written on the whiteboard.
    • type - create the next postit/card - type next thought - insert picture - and so on
    • no unnecessary switching between mouse and keyboard
    • no clicking in the toolbar until I have opened and placed a new postit/card
      (just double click or use a keyboard shortcut to insert new postits/cards)
    • For me it’s those simple mini-features that make a whiteboard very usable.
  • postit/card
    • group them by areas
    • select several elements and arrange them automatically (horizontally, vertically, grid)
    • insert symbols
    • add headings
  • canvas should be expandable in all directions and have no limits
  • place postits/cards and images freely
  • a good amount of zooming in and out
  • handling must be intuitive and well thought out
    • simple things like - you type the text into a postit and press e.g. tab and the next postit opens immediately (is automatically placed next to it) and you can continue typing right away
    • simple transfer with copy and paste (e.g. several text parts become several postits when pasting them into the board)
  • Export features to share the board as image and/or pdf

experience with whiteboards:

what other whiteboard/mindmap programs have you used before, describe their strengths or how they could be improved

  • As written above “Mural” is the perfect whiteboard for me. I have used it extensively since the beginning of the pandemic and we have used it successfully in different teams to collaborate.
  • :warning: But I don’t think Logseq should try to compete against it. The effort could be spent better on other features.
3 Likes

some white board

  • roam-spatial-
  • excalidraw
    • Similar mapping software?
      drawio,
  • scrintal,
    • Similar :
      milanote
      muse
      clover
      xtiles
  • kosmik,
  • heptabase,
  • napkin

(May continue to supplement,)

4 Likes

use-case :

  • I would like to use them as a visual daily journal. Seeing my days laid out in cards with an “image of the day” on each card with maybe (like the notion gallery view)some caption text below the image in the card ( or superimposed on top of the image)
  • I would love to use them to show visual of goals. Again image on the card and then a goal description, progress bar superimposed. (Could be used for projects…habits…whatever)

most wanted features :

  • images on cards (aesthetically pleasing)
  • ability to have text below or superimposed (tastefully) on card image).
  • sorting/grouping/filtering options for cards (like one view shows only cards tagged as such and then another)
  • cards a slinks maybe?

experience with whiteboards:

  • I’ve used miro and it’s pretty awesome. Feels infinite and I find that for the most part if you think hey can I do or add this …you can

questions / random thoughts :

  • I realize my visual journal thing or using cards for goals/project tracking isn’t a whiteboard thing but if the building blocks are there it would be awesome.
2 Likes

This is so exciting! I’m very interested in white-boarding in logseq. I was playing around with Cytoscape.js to try to mock something up before the recent post showing TLdraw. While I think TLdraw is probably a better library to use I just wanted to share what I’ve noodling with.

What i really like about cytoscape is the ability to nest components in a way that feels really right for parent child relationships. I hope that whatever is build with TLdraw is able to be as granular and can really allow user to whiteboard on a block by block level.

1 Like

use-case :

  • I would like to create visual maps of knowledge that contain drawings, texts and images and connections between those elements and be able to relate each element to another map or logseq note as means of navigation.
  • I would like to create my own “graph view” by drawing a map based on a specific subject and then organize and reposition its elements or even have different visual representations of them, so it would be a map made of pages represented by drawings / texts / elements / images and that could also have other maps inside them.

most wanted features :

  • Be able to insert multimedia content, draw with a tablet, write text with custom fonts inside a whiteboard.
  • Connect map elements with stylized lines.
  • Infinite Area Canvas
  • Some way of defining areas or layers that contains a fixed position group of elements, moving that area / layer moves everything inside the layer, you can draw / place content inside that layer area.
  • Each element or area inserted could have an associated page / map to it, clicking on it would navigate to or preview the page / map that it points to.
  • Visual Styling Options over the text, drawing, layers, areas, connection lines with border styling, colors and things like that.
  • Different styles of “brushes” when using a Drawing Tablet for drawing / coloring something, there is a video on Excalidraw where the coloring is very stylized and I liked it, the coloring on Khan Academy videos also remind me of a teacher’s drawings on a blackboard.
  • Preview page content without exiting the Map view.
  • Should be easy to use, the user interaction with the system should be quick and easy when creating new notes on the map, connecting to other elements, creating an area, relating to a page and editing the page content while on the map.

experience with whiteboards:

  • I have used some open source mind map applications, but they had exact path to the images and elements inserted, instead of relative, this caused problems when backing up data.

questions / random thoughts :

  • I found this coloring to be very beautiful and versatile image
1 Like

use-case :

When using logseq in a “single user mode” I would use “graphics” ( in general ) only when absolutely necessary. However there are times when a flow chart or other “white board”/“free flow diagrams” would be useful to organize and express relationships between things.

most wanted features :

Regardless of how a whiteboard is implemented in logseq ( maybe using mermaid - Markdownish syntax for generating flowcharts, sequence diagrams, class diagrams, gantt charts and git graphs. and or other such approaches?) I would hope that the logseq query functions would be able to find all text and maybe follow relationships ( arrows / links ) between those text “blobs” too. I think the challenge of supporting traversal of cyclic graph traversal would be a very challenging task to solve.

Maybe a good starting point would be some kind of “canvas” in logseq to make building mermaid syntax via visual toolbar/buttons/drag-n-drop paradigms would be a low code functional solution to start with? I am thinking a new kind of “diagram/whiteboard” quote block that would bring up a toolbar to add new items and link them, etc… etc…

Then focus on getting the logseq query enhancements to be able to search those diagrams done after that.

experience with whiteboards:

Visio is by far the best general purpose tool. However, it is not very easy to use due to all of the flexibility and “clicky-clicky” (modes and “hit box”/“handles” that pop-up/hide ) learning curve.

I would suggest keeping the shape set small and straight forward with optional text blobs OR links to a block elsewhere in logseq. (Maybe even support a new kind of “Template” to extend the toolbar with local template blocks too.) Text blobs, Images would be useful too. But that may also lead to wanting to “draw on the images”. (aka: image editing ) I think Image editing is best left outside of logseq.

questions / random thoughts :

Maybe an HTML5 canvas would also be an implementation option. That could leave logseq able to query/search the contents too. Though it would likely be more work than starting with mermaid syntax too.

(for some reason, I’m not able to edit the first post…)

update 2022/05 : devs (@Peng_Xiao and @tienson) have started to work on the whiteboard branch of logseq, the initial implementation seems based on tldraw/next, the new iteration of the excellent GitHub - tldraw/tldraw: A tiny little drawing app. by Steve Ruiz (twiiter: https://twitter.com/steveruizok)

here’s some links with early videos of logseq+tldraw :

9 Likes

some qol features I’d like to see:

  • custom points of views, like Miro’s Frames or Plectica’s Waypoints:

  • a Minimap to get an overview of the canvas and quickly move to the relevant area

3 Likes

Adding to these, probably some inspiration from https://getmicropad.com/ and https://kinopio.club/ would do wonders :heart_eyes:

Related to drawio, I would not compare it to excalidraw. An important benefit over the simpler tools is the ability to hold all kinds of metadata per node object and keep relational edges directional. It allows to display mermaid syntax and creation from tabled data, offers a nice XML file format and embedding source in proper formatted SVG, PNG and PDF Export. It supports nested diagrams. It is not a nice collaborating Whiteboard at all, but a poweruser tool.
I see a general challenge in integration of drawing tools with ability for diagramming into logseq to allow roundtripping workflow for edits in Draw.io GUI and propagate them back to structured text source.

FYI: There is acurrent WIP to integrate tldraw.io into the bigbluebutton opensource videoconferencing server for collaboration during online conferences. maybe you can get some helpful input in foresight of future colaboration features in logseq, as one of the tldraw features is an etherpad like coworking on the whiteboard. Integrate external whiteboard solution (tl;draw) in BigBlueButton · Issue #14976 · bigbluebutton/bigbluebutton · GitHub The integration is targeted in the version 2.6 coming after 2.5 that is currently in prerelease state.

3 Likes

I think https://museapp.com/ should be referenced in this thread.
It’s canvas UI has some very interesting constraints that reduce complexity. For example there is just a single zoom level and while the canvas is infinite, it’s “anchored to the upper-left, and expand to the lower-right as you add content.”

5 Likes

Thanks for all the suggestions. This feature is now on the short term roadmap, @Aryan @Peng_Xiao and I are working on developing a minimal version of whiteboards to complement Logseq’s outliner mode. I look forward to sharing more about the feature’s specification, design/functionality soon.

9 Likes

I am waiting for this whiteboard feature. Does anyone know when it will be available to the public?

1 Like

No ETA at the moment. It is, however more in the short/medium term than long term.

3 Likes

Will this feature be available in the android app? I have a moto g stylus phone and this would be the perfect app on the phone with that.

Please, take into account the possibility that the position of the elements responds to the criteria of a query, and not that they have an absolute position in a given array.

Some kind of semantically defined position of the blocks. Like another representation of the graph.