I’m not a dev, just an alpha tester but we talked about a similar feature with the dev, I also hope we can have ‘adaptative layouts’ or dynamic templates based on properties or queries.
could you expand on your use-case and maybe describe how you envision this feature ? I think this would be helpful ![]()
1 Like
For example, let’s say that it is a frame in which we place several blocks in different positions, some larger or with larger fonts than others, some connected taxonomically, others isolated forming a group by proximity, different colors, etc. . A mental map in graphic logic adds information to us and at the same time facilitates the interpretation and conceptualization of the matter in question.
It is not difficult to imagine, nor would it be difficult to save the information in some format. After all, it’s about coordinates, font sizes, vector arrows, colors…
But imagine that the map I describe above is actually a visualization that responds to the result of a query.
Well, it’s not hard to imagine either, the graph visualization in Logseq is just that.
Now, what we are talking about here is, in a way, the reverse process. Draw a map and let the graphic logic generate the semantics that could be consulted later and be represented with different visualizations, but with the same underlying logic.
If it turns out to be interesting, I suppose we could evaluate different possibilities.
use-case :
summarize/accumulate knowledge about a topic. I Often need multiple levels of abstraction
most wanted features :
whiteboards can be nested
experience with whiteboards:
questions / random thoughts :
say, a block can be a whiteboard?
1 Like
Will this whiteboard replacing excalidraw? or will it be work side by side?
I am longing this whiteboard,
and full screen mode for excalidraw
2 Likes
No, Excalidraw is for generic drawings inside a block. Whiteboards are a way to organize spatially Logseq objects like blocks, pages, queries etc, create relations between them by drawing arrows and eventually draw shapes to better organize them.
4 Likes
That’s right. The point here is, IMHO, that a Logseq whiteboard is, like pages, a special block that represents a set of blocks, but this time, the key is the semantically defined spatial position of the blocks and other graphical representations of the semantic relations between them.
Nice to know that,
for excalidraw will it be get updated?
Because I see that it still need many improvements,
like fullscreen mode, etc
It was recently updated to 0.12.0!
1 Like
I mean excalidraw in the logseq.
Indeed, I mean, of course Excalidraw itself continues its development.
As you can see from latest Logseq release changelog, Excalidraw has been updated to 0.12.0 (last bullet point):
In general you can see dependencies in this file:
1 Like
Thank you to @cannibalox, @Peng_Xiao, @Aryan. I would pay money to accelerate this specific development.
use-case :
- Concept maps,
- argument maps,
- debate graphs,
- controversy mapping,
- complex system interaction visualization
Logseq et al talk of their “knowledge graphs” which indeed are useful but not real graphs of knowledge. Well, if so, they are lower-order. Information becomes knowledge when the conceptual relationship between info blocks is articulated. Currently the link is basic hypertextual. Higher-order linking would articulate how one data block influences/modifies/compares etc to the other. These links can be tailored depending on the conceptual model or philosophical framework being employed. And a data block can sit in multiple models or frameworks.
most wanted features :
- Link text/types are real. They exist as blocks/pages just like notes do. They are not just a text box.
- hide/unhide links between blocks. (There may be multiple)
- export to html and svg
- nested maps/whiteboards.
- drop-down and/or scroll-over/tooltip of block in map to reveal more info.
- Shift-click or similar to open map/whiteboard node as note in sidebar to read detail
- Multiple line types available for multiple link types
- Map templates
experience with whiteboards:
Cmap Tools (concept mapping)
Tinderbox
Rationale (argument mapping)
Compendium (Dialogue mapping)
questions / random thoughts :
In these notetaking 2.0 communities, there is much talk of “Maps of Content”…but they are not maps. They are lists. This functionality could make a real map!
Trillium Notes seems to do what i’m talking about quite well already but everything else is inferior to Logseq.
5 Likes
- idea to add code snippets into the whiteboard with highlighting
1 Like
I see that whiteboards have been released in beta but I can’t seem to find a place for discussion of this feature. No one has posted in this thread since release. Could someone please direct me to active discussion?
It’s in beta now, so for bakers only, and on Discord there is a forum-like channel for whiteboards that only bakers can see.
Just started using LogSeq, is there any update on this whiteboard functionality coming out of beta?
it was publically released with version 0.9.0
Ahh, I just updated and see it now! Yay!
1 Like
Use Case: Describe Why You Need Whiteboards and How You Use Them
Whiteboards are primarily used for two purposes:
- To help visualize and organize thoughts, usually used for complex problems;
- To visualize my thoughts on a complex problem, making it easy for me to review quickly or share it with others.
Most Wanted Features: What Do You Need?
-
The transformation of whiteboard views into a trello-like list: The whiteboard view can be transformed into a trello-like list (according to the relationship lines and hierarchy in the whiteboard). The resulting list can be messy if it is, and can be edited in the list view. Logseq will record the edits in the list view.
-
Automatically showing bidirectional link relationships in the whiteboard view( reference to Lattics).
-
After writing the article in hierarchical ways, you can export Word and MD at a single click. This is very convenient for writing.
Experience with Whiteboards: What other Whiteboard/Mindmap programs have you used before, describe their strengths or how they could be improved
Lattics
Strengths:
-
The article can be split into hierarchical levels and the whiteboard view can be generated based on the hierarchy. The whiteboard view can be freely edited and the hierarchy relationship will be synced to the list view.
-
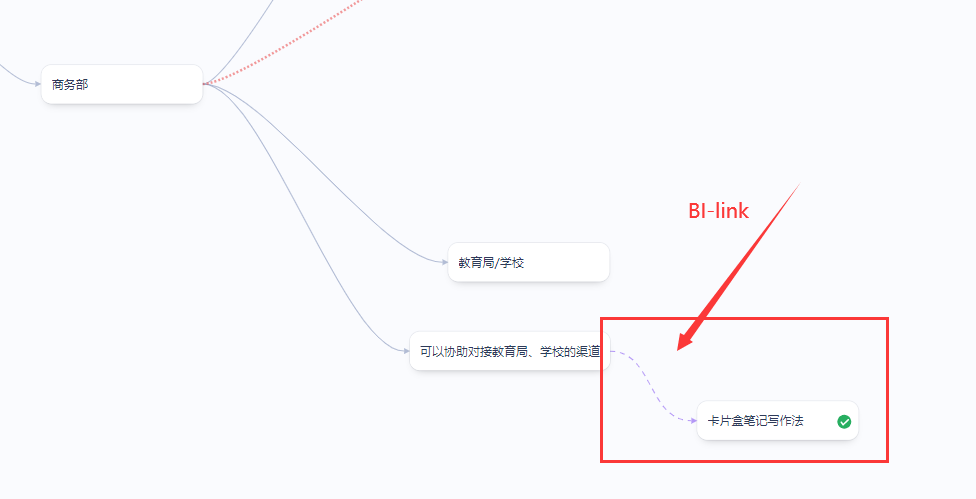
The whiteboard view shows bidirectional link relationships, shown via dashed lines, which is very helpful for us to discover potential connections.
-
After writing the article in hierarchical ways, you can export Word and MD at a single click. This is very convenient for writing.
1 Like