Introduction
- Nothing original here, just another wrapper of library chart.js
- Except that it comes in the form of a kit, so it works on mobile as well.
- It is a simple implementation that:
- covers basic needs of average Logseq users
- breaks when pushed beyond typical usage
- sets the groundwork for javascript users to plot more advanced charts
- For alternative options, check the links below this post.
Usage
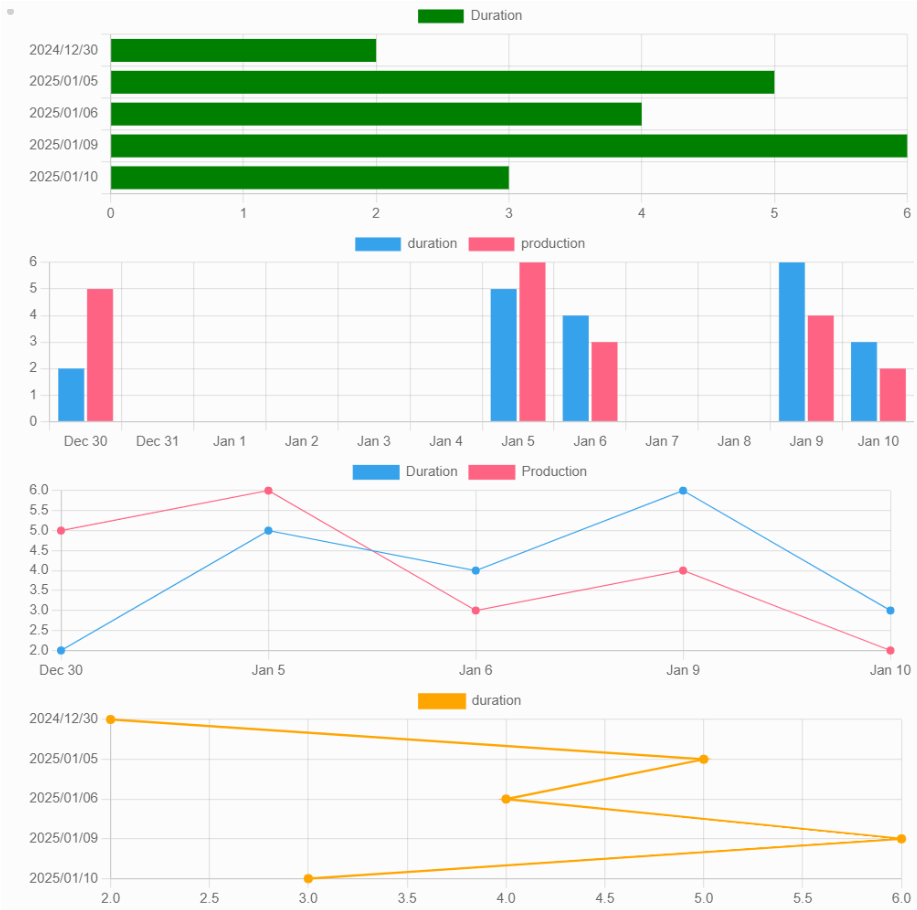
- To get output like these:
- by typing inside a block a macro (or more) like these:
{{bar duration, Duration}} {{barv duration|production}} {{line duration|production, Duration|Production}} {{linev duration}}- The meaning of the format
{{macroname propname, title}}being:titleis the text that appears in the legend- Supports multiple series, just like
propname(right below).
- Supports multiple series, just like
propnameis typically the name of a Logseq property- Can also be any top-level key/fieldname in the query’s results.
- For multiple series, it can have multiple values separated by
|- Check the examples above.
- The separator is easily configurable in the beginning of the code (at the end of the post).
macronameis an arbitrary name of your choice, as defined inside fileconfig.edn, insidemacros{}, similar to these ones::bar "<div class='kit chart' data-kit='chart' data-type='bar' data-prop='$1' data-title='$2' data-color='green' data-index-axis='y' />" :barv "<div class='kit chart' data-kit='chart' data-type='bar' data-prop='$1' data-title='$2' data-scales='x-time-day' />" :line "<div class='kit chart' data-kit='chart' data-type='line' data-prop='$1' data-title='$2' data-width='1' data-scales='x-timeseries' />" :linev "<div class='kit chart' data-kit='chart' data-type='line' data-prop='$1' data-title='$2' data-width='2' data-color='orange' data-index-axis='y' />"vis for vertical, but you can use names of your preference.- Should still be unique names.
- For basic customization, modify the
data-attributes:- type: typically bar or line, but chart.js supports many more
- color: typical CSS colors for the data
- Supports multiple series, just like
propname(see earlier). - For the color of other elements, see lower.
- Supports multiple series, just like
- width: line-width in pixels
- Supports multiple series, just like
propname(see earlier). - For the dimensions of the chart itself, see lower.
- Supports multiple series, just like
- index-axis: When set to
ytoggles between horizontal and vertical bars/lines - aspect-ratio: When set to
trueprevents disproportional charts, but may waste some space. - scales: Picks among several predefined sets of options for one or both scales.
- Such definitions require basic knowledge of object-notation.
- Check
const SCALESnear the end of the code (at the end of the post).
- Check
- For the available options, check the documentation of chart.js
- You may also have to load extra libraries and adapters, which are not loaded by default.
- An example for library
moment.jsand its adapter is found commented in the code.- Check
const scriptstowards the end of the code (at the end of the post).
- Check
- An example for library
- Such definitions require basic knowledge of object-notation.
- For CSS customization (other colors, dimensions etc.), use the defined class (here
.kit.chart), e.g.:.kit.chart { height: 400px; }
- The meaning of the format
- The query should be placed in a child-block:
- Both simple and advanced queries are supported, e.g.:
{{query (page-property :duration)}}- The duration property of every page that has one.
-
#+BEGIN_QUERY { :query [:find (pull ?b [*]) :where [?b :block/name ?name] [?b :block/properties ?props] [(get ?props :duration) ?duration] ] } #+END_QUERY- Advanced variation of the previous query.
- Useful for advanced filtering, result transformations etc.
- Advanced variation of the previous query.
-
#+BEGIN_QUERY { :query [:find ?name ?duration :keys label data :where [?b :block/name ?name] [?b :block/properties ?props] [(get ?props :duration) ?duration] ] } #+END_QUERY- This one demonstrates the use of
:keys label data- Useful when properties are not convenient.
- This one demonstrates the use of
- Both simple and advanced queries are supported, e.g.:
- kits are expected inside file
custom.js - And the following code in a single javascript code-block inside page
Chart:const DELIMITER = '|' const DFLT = { color: '#36A2EB|#FF6384|#4BC0C0|#FF9F40|#9966FF|#FFCD56|#C9CBCF'.split('|'), width: ['0'] } const LS = logseq.api const Module = logseq.Module const Kits = Module.Kits const Msg = Module.Msg function advancedQuery(content, queryWord){ const queryStart = content.indexOf("[", queryWord + 5) if (queryStart < 0) return var queryEnd = queryStart + 1 var n = 1 while (n > 0) { const close = content.indexOf("]", queryEnd) if (close < 0) return const open = content.indexOf("[", queryEnd) if (close < open || open < 0) { queryEnd = close + 1 n -= 1 continue } queryEnd = open + 1 n += 1 } return content.slice(queryStart, queryEnd) } function simpleQuery(content, queryWord){ const queryStart = queryWord + 6 const queryEnd = content.indexOf("}}", queryStart) return content.slice(queryStart, queryEnd) } function getResults(content, queryWord){ if (queryWord < 0) return if (content[queryWord - 1] === ":") { const query = advancedQuery(content, queryWord) if (query) return LS.datascript_query(query).flat() } else if (content.slice(queryWord - 2, queryWord) === "{{") { const query = simpleQuery(content, queryWord) if (query) return LS.custom_query(query) } } function Plotter(div){ return {div, dataset: div.dataset, data: [], prop: div.dataset.prop.split(DELIMITER), __proto__: Plotter.prototype}; } Plotter.prototype.attemptPlot = function(){ let msg = "No results" try { this.findResults() if (this.res) { this.fillData() this.readDataset(this.dataset) this.plot() } } catch(e) { msg = "Error: " + e.message this.data.length = 0 } if (this.data.length > 0) return const spanMsg = Kits.createElementOfClass("span", "text-sm", msg) this.div.appendChild(spanMsg) } Plotter.prototype.fillData = function(){ this.prop.forEach( (p)=>this.data.push(this.res.map( (r)=>{ const v = Number(r.properties?.[p] ?? r[p] ?? r.data) return (isNaN(v) ? 0 : v) })) ) } Plotter.prototype.findResults = function(){ const parent = this.div.closest("div.ls-block") const child = parent.querySelector("div.ls-block") if (!child) return Msg.warning("Missing child") const blockId = child.getAttribute("blockid") const block = LS.get_block(blockId) const content = block.content.replace(/\n?.*[:][:].*\n?/g, "\n").trim() const queryWord = content.indexOf("query") this.res = getResults(content, queryWord) ?? Msg.warning("Missing query") } Plotter.prototype.getDatasets = function(){ return this.data.map( (data, i)=>{ const color = this.color[i] ?? this.color[0] return { backgroundColor: color, borderColor: color, borderWidth: Number(this.width[i] ?? this.width[0]), data, label: this.title[i] ?? this.prop[i] } }) } Plotter.prototype.labelForResult = function(r){ return r.label ?? r.originalName ?? r['original-name'] ?? LS.get_page(r.page.id).originalName } Plotter.prototype.plot = function(){ const dataset = this.dataset const canvas = document.createElement('canvas') this.div.appendChild(canvas) new Chart(canvas, { data: { datasets: this.getDatasets(), labels: this.res.map(this.labelForResult, this) }, options: { indexAxis: dataset.indexAxis ?? 'x', maintainAspectRatio: dataset.aspectRatio || false, scales: SCALES[dataset.scales] ?? {} }, type: dataset.type }) } Plotter.prototype.readDataset = function(dataset){ this.color = (!dataset.color) ? DFLT.color : dataset.color.split(DELIMITER) this.title = (dataset.title === '$2') ? [] : dataset.title.split(DELIMITER) this.width = (!dataset.width) ? DFLT.width : dataset.width.split(DELIMITER) } const plotters = [] function onScriptsLoaded(){ Msg.info("All chart scripts loaded") plotters.forEach( (plotter)=>plotter.attemptPlot() ) plotters.length = 0 } function loadScript(url, onLoaded){ const script = document.createElement('script') script.src = url script.type = 'text/javascript' document.body.appendChild(script) if (onLoaded) script.addEventListener("load", onLoaded) } function loadNextScript(){ const script = scripts.shift() Msg.info("Loading " + script.name + " ...") loadScript(script.url, (scripts.length > 0 ? loadNextScript : onScriptsLoaded)) } const scripts = [ {name: 'chart.js', url: "https://cdn.jsdelivr.net/npm/chart.js"}, // {name: 'moment.js', url: "https://cdn.jsdelivr.net/npm/moment"}, // {name: 'adapter', url: "https://cdn.jsdelivr.net/npm/chartjs-adapter-moment"} ] const SCALES = { "x-timeseries": { x: { type: 'timeseries' } }, "y-timeseries": { y: { type: 'timeseries' } }, "x-time-day": { x: { type: 'time', time: { unit: 'day' } } }, "y-time-day": { y: { type: 'time', time: { unit: 'day' } } } } logseq.kits.setStatic(function chart(div){ const plotter = Plotter(div) if (window.Chart) return plotter.attemptPlot() if (plotters.length === 0) loadNextScript() plotters.push(plotter) })