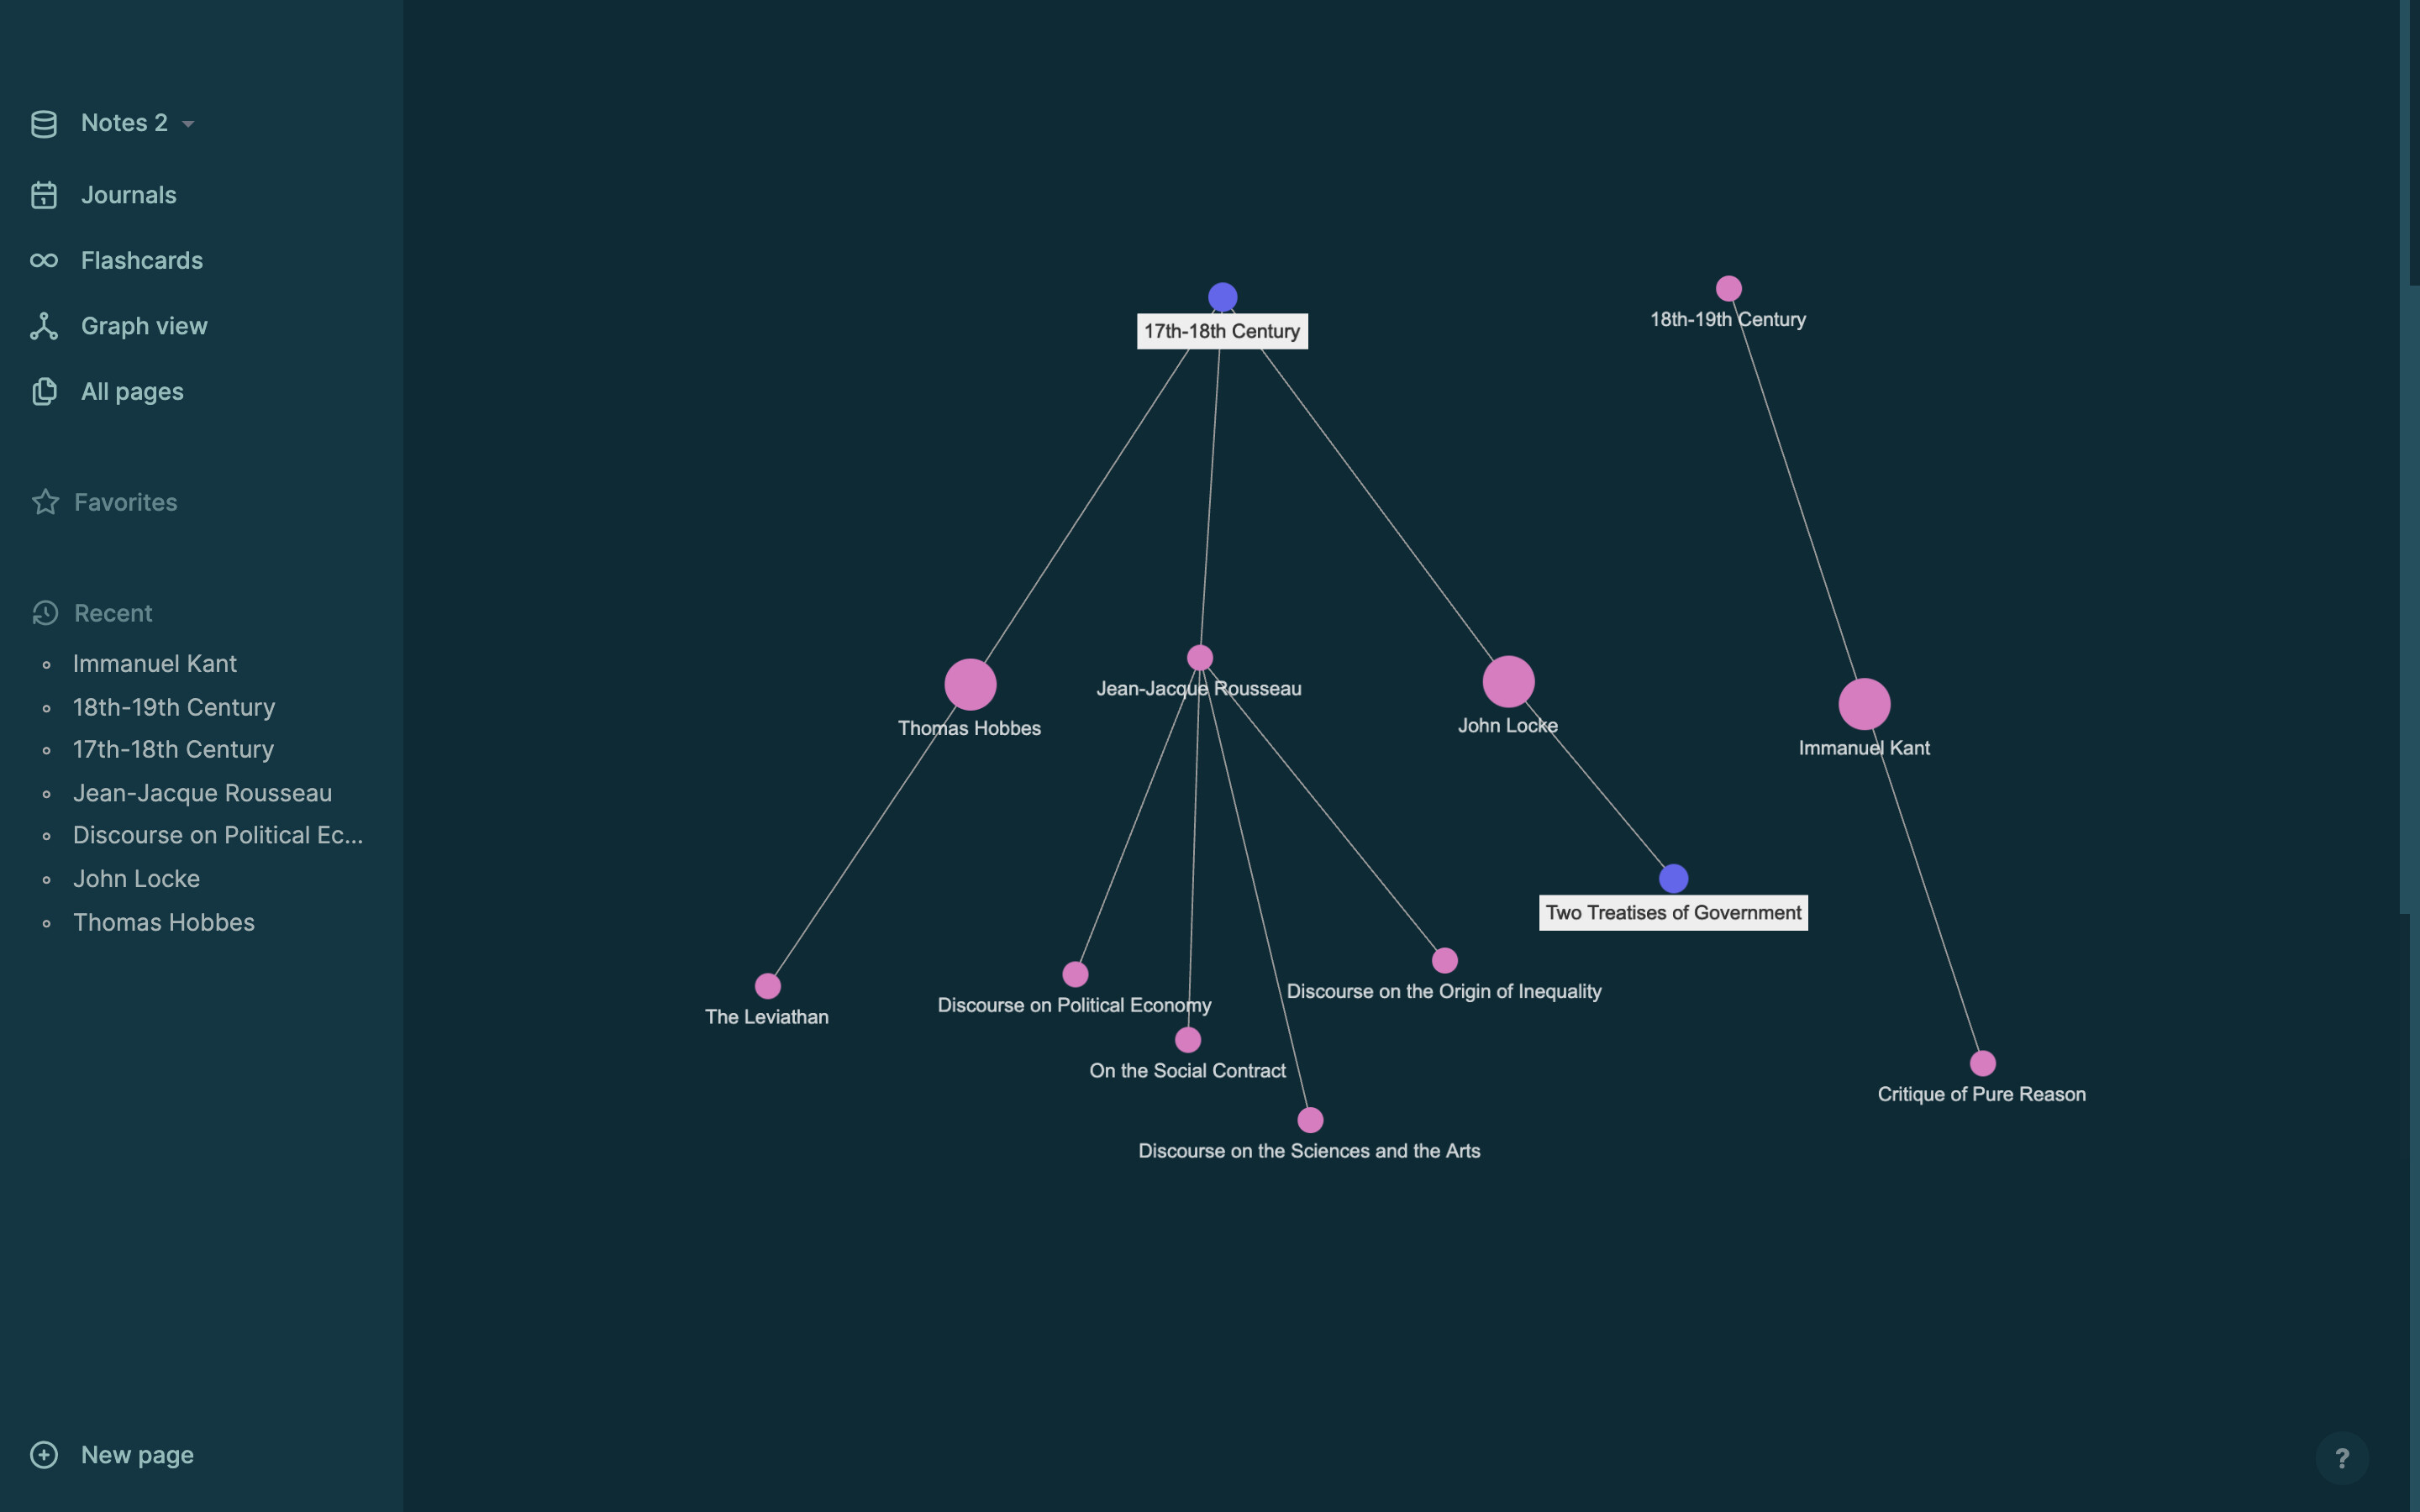
This software was introduced by a software engineering friend of mine who was looking to get more productive. I’m not super distant from programming even though I study mostly in social sciences and humanities, so while I’m perhaps a little distant with the field than the rest of you guys, I thought it would be a totally fun experiment to use this software to build a canon of traditional Western philosophy that are linked together by their main ideas. Many influential political theorists/philosophers draw from a lovely variety of other thinkers from a variety of eras. I started a simple graph as a test and the method of organization was such:
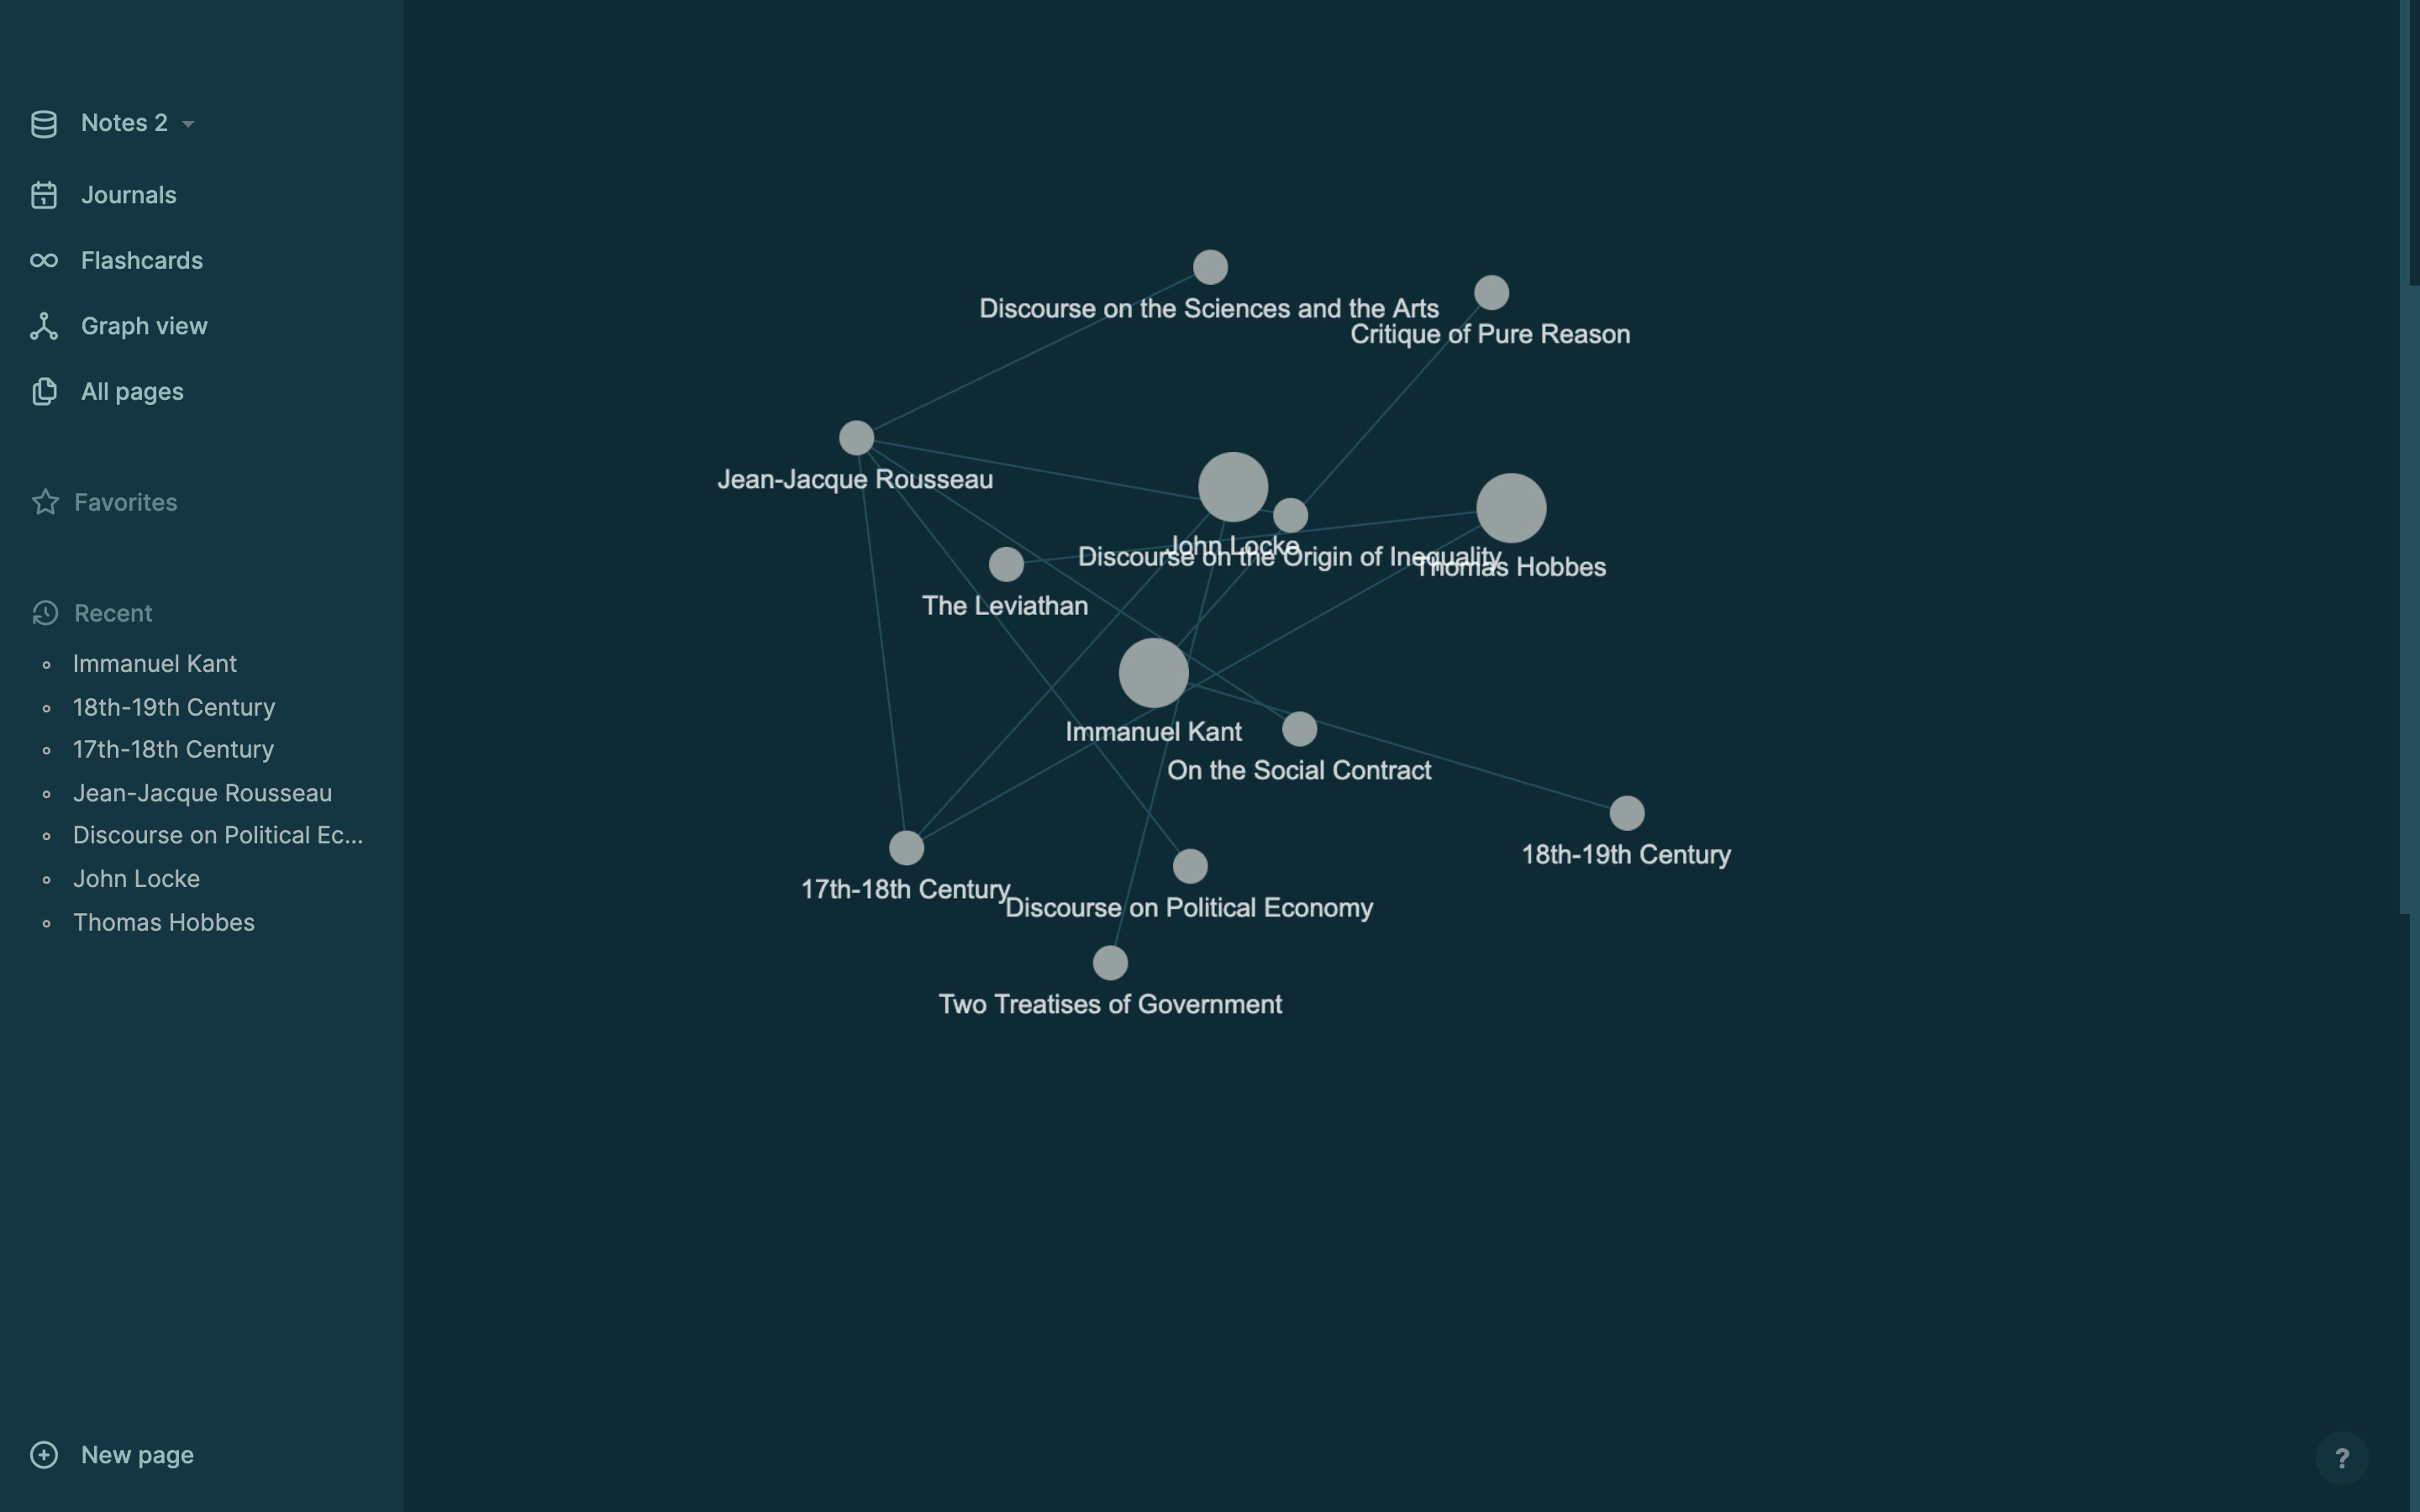
Time periods be the base node that expands outward like a tree. Ideas could link to some other philosopher’s idea of any era. You could have Chomsky refer to some idea of his that he claims influenced by some Continental philosopher. I imagined that when expanded, it would turn to be a very interesting graph of linked nodes! The problem is that this isn’t permanent. When I click elsewhere it immediately reverts to this:
This is a pain if I want to expand this. I think this shouldn’t be too hard to change and I think this would be interesting to see! Any thoughts on this?
The upcoming Whiteboards feature better fits your use case while Graph View is meant to visualize the knowledge graph: the point is calculating the distances between pages to reflect how much the are related.
Branstorming rant warning:
Still, maybe it’s possible to improve graph browsing part. (e.g. save configuration of notes, so later can be loaded from file, and new nodes attached ; or ability to load e.g. webassembly blob with layout algorithm, or some plugin for browsing graph starting from some point and adding neighbours by clicking)
As illustrated by the OP’s 2 examples, the current behavior doesn’t allow one to visualize anything in that rats nest.
The current status is so bad, even with just a dozen nodes, that it makes me wonder what did the devs intend people to do with it. Reorganize it every time that it’s opened? … while the nodes float away? I can see that working as a mindnumbing game, but not for organizing information.
@hmijail the distance between nodes in the Graph View depends on how pages are linked together by references. It’s meant to let you see how pages relate to each others. With a high number of nodes and connections the graph starts to make sense. You are not supposed to look at each connection but look at how pages aggregate. I hope what I mean here is clear. This is why the nodes’ position is calculated every time you open the Graph View.
Sorry @alex0, I got your point, but I resonate much more with @hmijail description. I want to anchor some key nodes and others can be calculated. Or as @Andrew_Kwang wrote. To fix the rearranged position. I don’t want to recreate my whole database into Whiteboard. I tried it and it’s too long and often I can forget for Pages. I often look into a Graph view to see what is not connected and SHIFT click to open on the right side of the page would be super helpful to add connection.
Hey all, I believe this is partially resolved by the 0.10.6 release. The graph forces have been improved and you can customise them to your own requirements. This should mean the graph layout it defaults to is not messy in the first place, as you can customise the forces used.
These are persistent when you click away and return to the graph page. The graph will rebuild, but with the forces chosen by you. This resulted in a significant improvement during testing