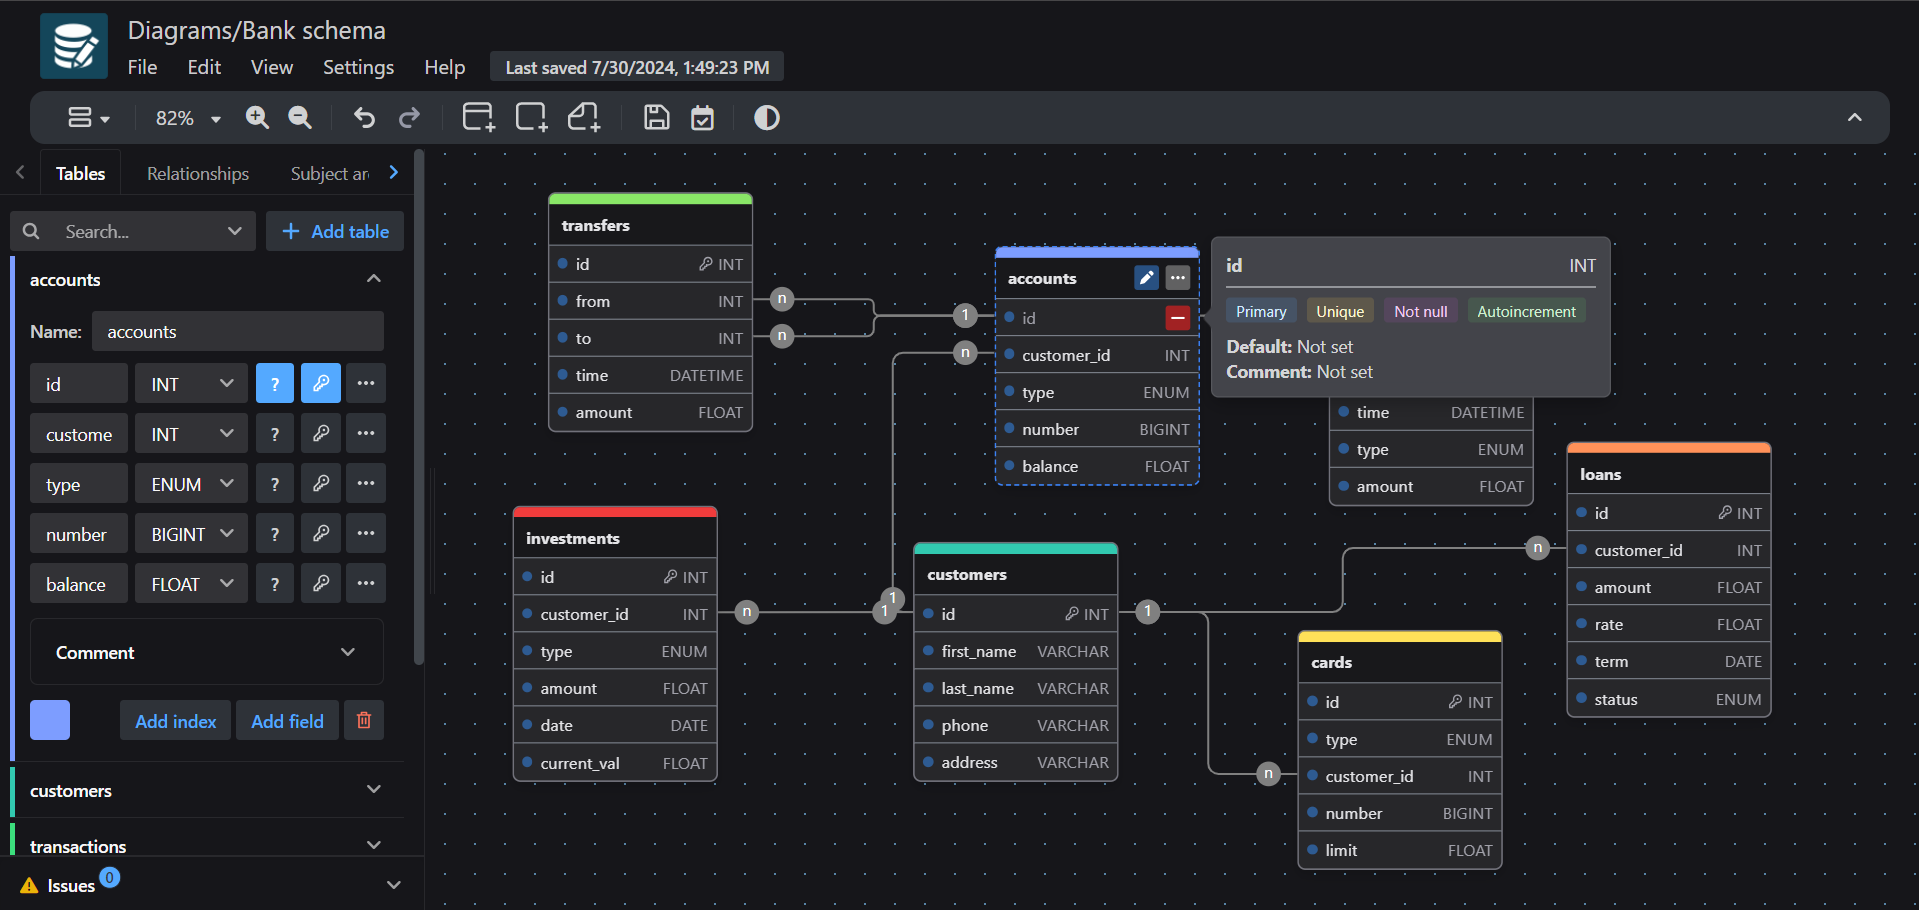
Having database entity-relationship diagram (with auto layout) would take Logseq to a different level.
Many of the already-existing tools are open-source and SQL-based, which makes adding the feature a tad bit easier I guess.
Having database entity-relationship diagram (with auto layout) would take Logseq to a different level.
Many of the already-existing tools are open-source and SQL-based, which makes adding the feature a tad bit easier I guess.
Hello, I’m not sure this is exactly what you want, but it may fit your need (depending on how you like “diagram as text”).
You can try niolesk.top it’s a web application that can help you embed diagrams like that described as text in a wiki application like mediawiki, confluence, or applications like logseq or obsidian without installing plugins (I let other persons giving similar answers with logseq plugins).
Start by editing the diagram on Niolesk . This is an example or entity relation diagram. You change de description of you schema and it automatically generate the corresponding diagram.
Then at the bottom, you click on the “Copy” button in the “markdown content” section.
You paste it in logseq (or obsidian, or any markdown compatible field).
You’ll get something like:
If you want to edit again the diagram, just click the link “Edit the diagram” and it will open the diagram.
Be carefull to replace the image AND the link as the whole diagram is contain in the edit link, not anywhere on the cloud.
@MahdiPorkari : For reference, here is a link to the schema on your example : Niolesk
And here is the rendered diagram :
why my logseq is different with you?
Because it’s not Logseq. It is a screenshot from another platform to showcase the idea.
I truly do appreciate your idea, and I absolutely love the idea of “diagram as text”.
It is indeed a useful tool but I’m looking for a tool that can do it itself based on the structure of my Logseq blocks and properties.
How? Relationships can be drawn by either (1) using parent to child relationships, or (2) by node-type properties (if a node gets mentioned in a property, then an arrow would originate from that property to the mentioned node as an individual entity.
I’ve made a half-built demo by forking a plugin called “Outline Canvas” but my programming skills are far too limited for now to finish the job.
Here’s a screenshot:


