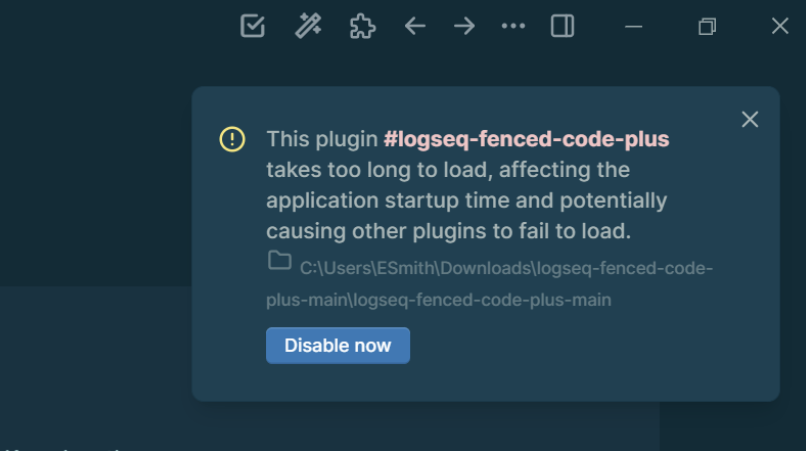
I’ve tried logseq-fenced-code-plus and logseq-mermaid-plugin but neither render for me. I installed both of them manually. I get this error
What tools do you all use? Any way I can fix this error?
I’ve tried logseq-fenced-code-plus and logseq-mermaid-plugin but neither render for me. I installed both of them manually. I get this error
What tools do you all use? Any way I can fix this error?
Some use Graphviz, e.g. How to load and use viz-standalone (Graphviz)?
@mentaloid Thanks. I have updated the custom.js but how do I now use graphviz? Do I have to use a code block, curly brackets or something else?
{{flowchart}}:flowchart "<div class='flowchart' />".querySelector('.flowchart')@mentaloid Darn. I guess this is out of my reach then. I don’t know anything beyond copying and pasting. I was attempting something like this
<div id="graph">
  <script type="text/vnd.graphviz">
    digraph G {
      A -> B;
      B -> C;
      C -> A;
      A -> D;
    }
  </script>
</div>
but it’s not rendering. I don’t have enough background knowledge to grasp the implications of what you explained. That being said, any direction you can provide on fixing the error in my original post would be appreciated even if it’s instructions on what I should be searching for to find a solution. Thanks in advance.
Thanks again for the help. Tried an LLM with no success. I guess I will just suffer without the feature.
Would you be able to install from the marketplace instead?
No. I’m using my work computer and the marketplace no longer connects after some system upgrades. I think it has something to do with the security of the connection so my workplace network is blocking it. @hkgnp
My approach is a bit hacky, but it is what I know how to do. It is quick enough to use because I have it in a template, I insert it, and it just works™. One day I will do better ; ).
If you already have pasted the javascript code for Graphviz in your custom.js file, @mentaloid 's amazing kits is the key to generate the graph:
I create a javascript block with the viz instance, a child to call the kits evalparent macro, followed by a block that only has the html to define the div with graph id.
See an example below.
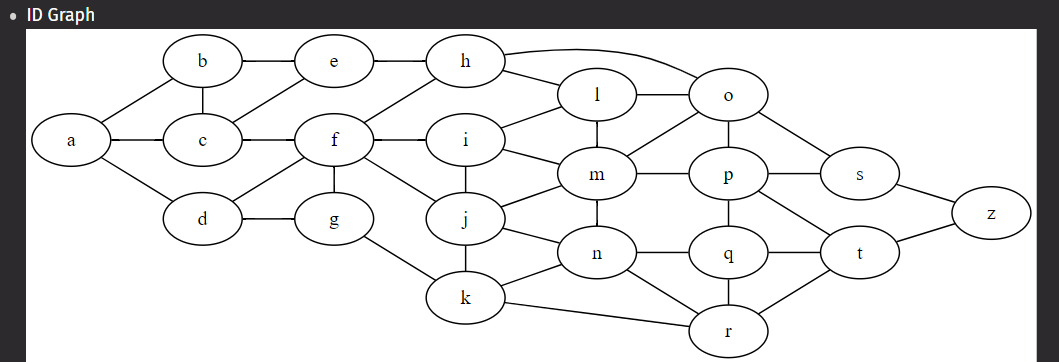
- ### Example [[Software/Graphviz]] within [[Software/logseq]] #[[logseq-meta/Diagrams]] #diagramming
	-
	  ```javascript
	    Viz.instance().then(function(viz) {
	      var svg = viz.renderSVGElement("graph {rankdir=LR;a -- { b c d }; b -- { c e }; c -- { e f }; d -- { f g }; e -- h;    f -- { h i j g }; g -- k; h -- { o l }; i -- { l m j }; j -- { m n k };    k -- { n r }; l -- { o m }; m -- { o p n }; n -- { q r };    o -- { s p }; p -- { s t q }; q -- { t r }; r -- t; s -- z; t -- z;    { rank=same; b, c, d }    { rank=same; e, f, g }    { rank=same; h, i, j, k }    { rank=same; l, m, n }    { rank=same; o, p, q, r }    { rank=same; s, t }}");
	      document.getElementById("graph").appendChild(svg);
	    });
	  ```
		- {{evalparent}}
	- <div id="graph">ID Graph</div>
Output:
@etc Thanks for the insight. I already had kits installed for some other functions. It’s working now that I know that I have to use the {{evalparent}} macro. I will make a template so it’s easy to insert a chart.