My approach is a bit hacky, but it is what I know how to do. It is quick enough to use because I have it in a template, I insert it, and it just works™. One day I will do better ; ).
If you already have pasted the javascript code for Graphviz in your custom.js file, @mentaloid 's amazing kits is the key to generate the graph:
I create a javascript block with the viz instance, a child to call the kits evalparent macro, followed by a block that only has the html to define the div with graph id.
See an example below.
- ### Example [[Software/Graphviz]] within [[Software/logseq]] #[[logseq-meta/Diagrams]] #diagramming
-
```javascript
Viz.instance().then(function(viz) {
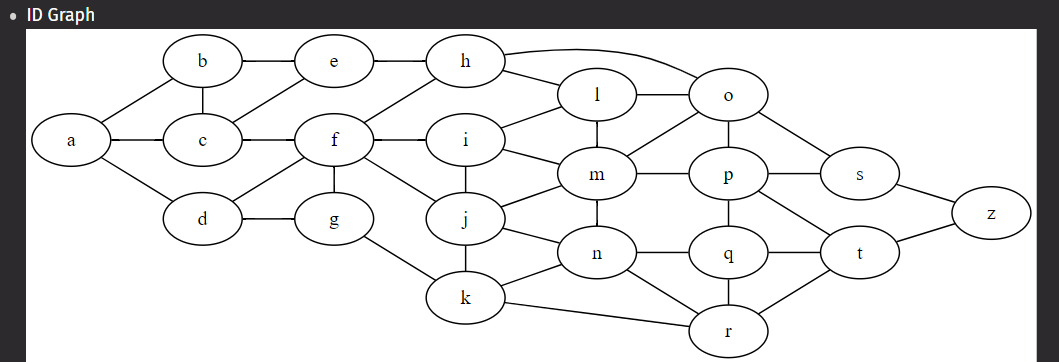
var svg = viz.renderSVGElement("graph {rankdir=LR;a -- { b c d }; b -- { c e }; c -- { e f }; d -- { f g }; e -- h; f -- { h i j g }; g -- k; h -- { o l }; i -- { l m j }; j -- { m n k }; k -- { n r }; l -- { o m }; m -- { o p n }; n -- { q r }; o -- { s p }; p -- { s t q }; q -- { t r }; r -- t; s -- z; t -- z; { rank=same; b, c, d } { rank=same; e, f, g } { rank=same; h, i, j, k } { rank=same; l, m, n } { rank=same; o, p, q, r } { rank=same; s, t }}");
document.getElementById("graph").appendChild(svg);
});
```
- {{evalparent}}
- <div id="graph">ID Graph</div>
Output: