Before you get started, it’s first necessary you have the Logseq desktop app installed. While it’s possible to use Logseq in a browser, we recommend the desktop app for a variety of reasons—speed being the main one. In the rest of this guide, we’ll assume you’re using the app.
To install the Logseq desktop app, head over to Logseq.com and click the blue button that says Download desktop app:
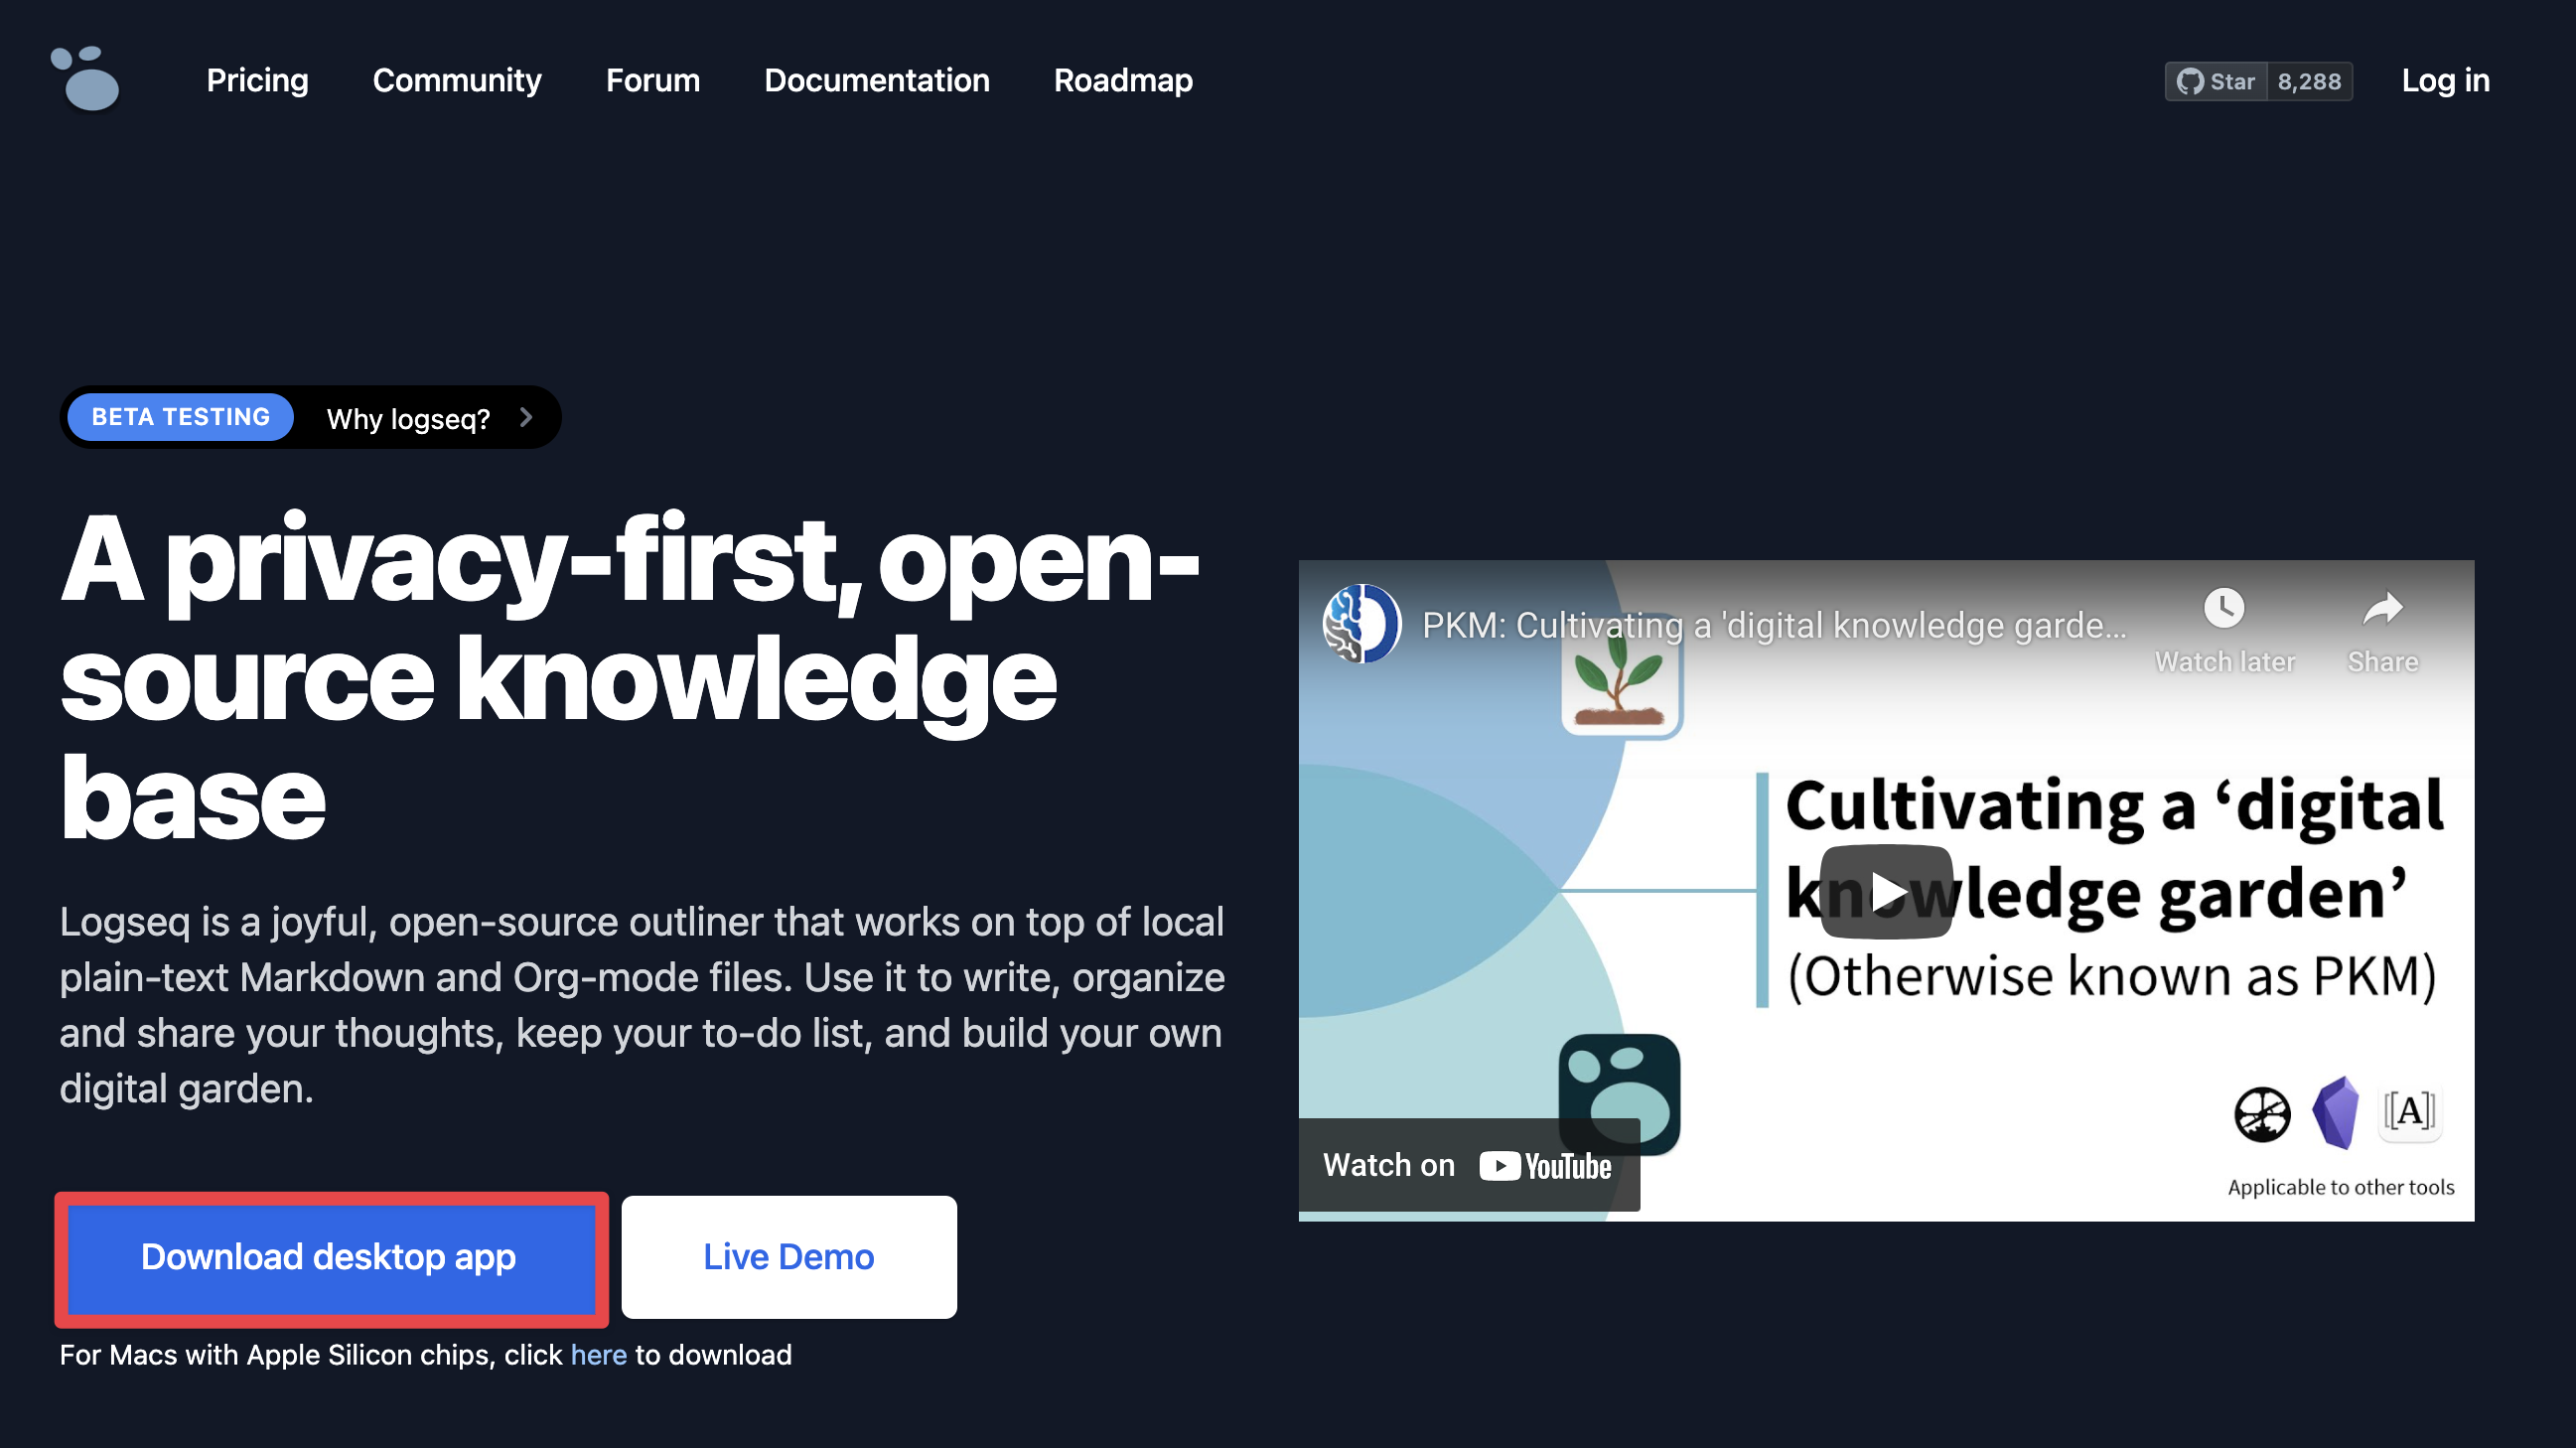
The site will automatically determine what Operating System you’re using and download the appropriate installation file.
After you’ve downloaded the installation file, install it as you would do any other app. Once that’s done, start Logseq.
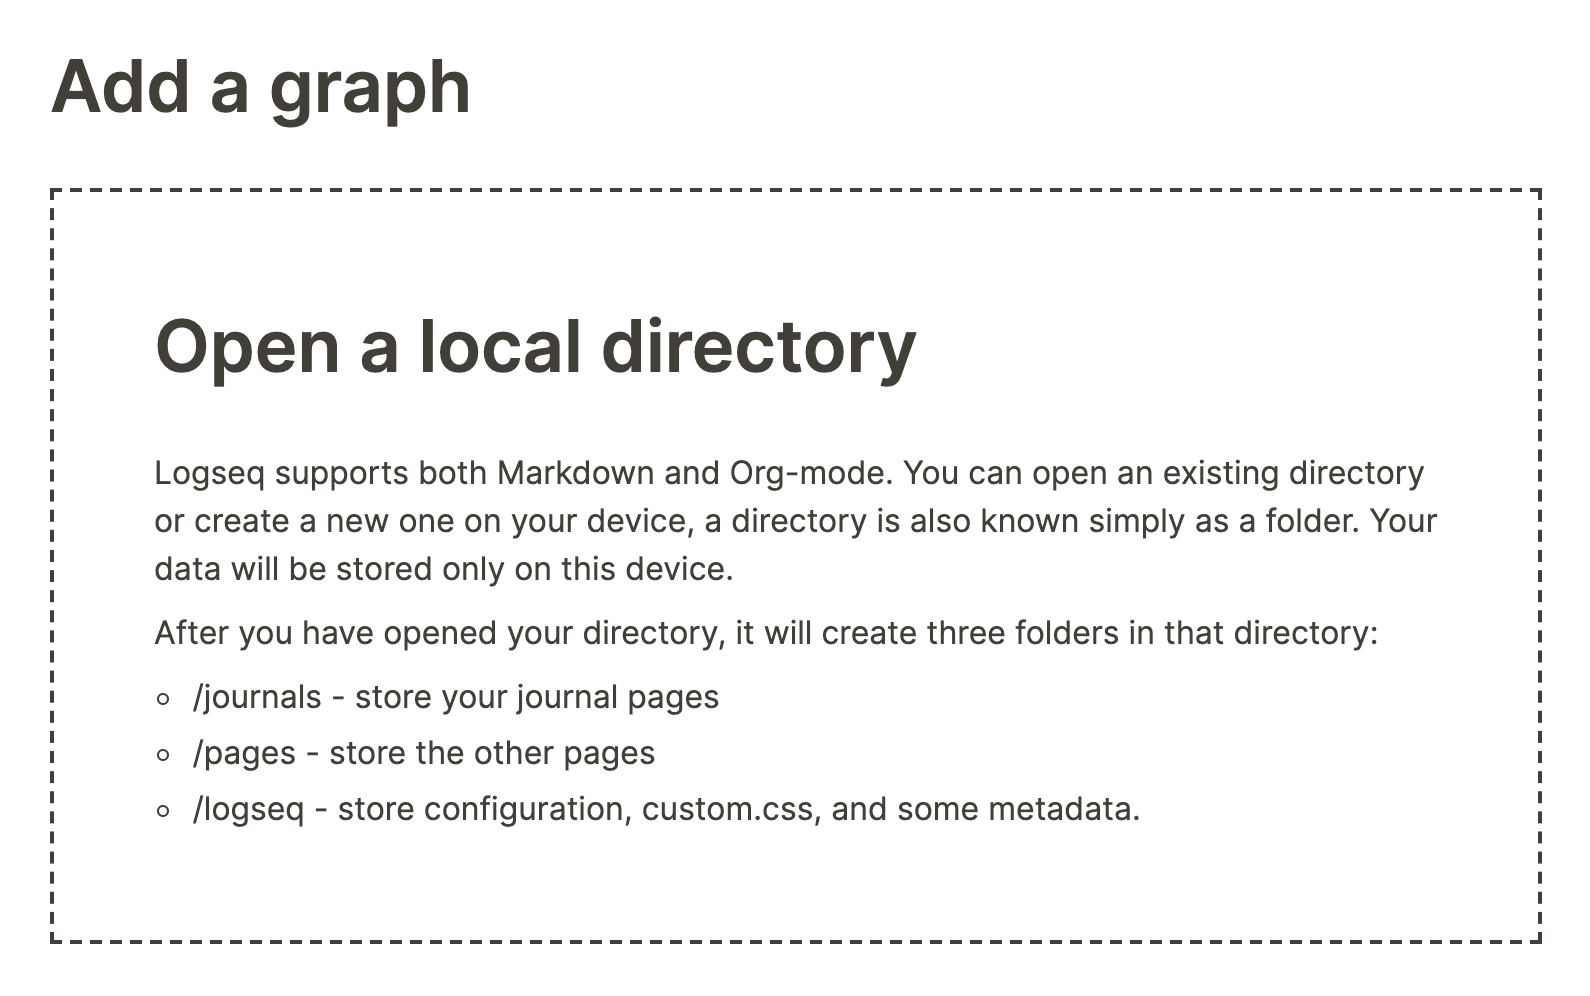
Opening Logseq for the first time, you’ll see the following screen telling you to open a local directory:
If you already have Markdown files you wish to use, look at the next section titled [[How to create a Logseq graph using existing Markdown files]].
For now, let’s assume you’ll start a new graph. Select a folder where you wish to store everything you do in Logseq. Once done, Logseq will open a page with today’s date; the Journals page. We’ll get back to this special type of page later.
Keep in mind that Logseq does not synchronize your data; it’ll be only stored on your local machine. In case you want an extra safeguard for your data, you can create your graph in a folder that’s synced via services like Dropbox or Google Drive. You can read more about this in the section [[How to sync your Logseq graph across devices]].
Now you’re ready for the fun part!