did you fix ? or remember what was ? yesterday it didnt happen but today it appears again making unusable. I also raised a bug , and saw similar complaints, most of them happens when you have multiple windows opened, but for me happens only with one window
i think is something with lazy loading and some event handling related to scroll but i didnt find a way to disable lazy loading.
This is the issue I was seeing = Negative performance impact to the references panel -- introduced after 0.8.0 · Issue #9507 · logseq/logseq · GitHub
Hi @Zyrohex - where do you find the console debugger and performance tab please? They sound super useful!
you need to type ctrl-shift-i
1 Like
Ahh, great, thank you!
Have you tried reindexing the graph?
Maybe the issue is in the index and not in your notes.
Logseq Flatpak version has a very bad performance. I also try to use Flatpak version but after testing AppImage version I decided to keep it. In my laptop AppImage has about 2x better performance than Flatpak. So I recommend you to try AppImage version, maybe it will be more usable ![]()
yes, but didnt solve
Yeah, if i didn’t have that same issue with windows , i would blame flatpak rsrsrs but in windows same thing happened, and i look in Logseq issues on github and there are plenty of people complaining about similar issue (the causes of appearance diverges, but the problem is the same). Looks like is something with pagination … Idk why Logseq still didn’t fix it, unfortunately had to move again to obsidian (because it just works). Hope that when Logseq release the database version things will be more smooth, until then, idk why Logseq didn’t fix these crucial issues asap
A potentially useful idea is to monitor and make sure that the Window Manager Objects (cursors, menus, keyboard layouts, windows, etc) that need to be displayed, do not approach an amount that will exceed your system’s capabilities (for example, the available amount of video memory / RAM & non-paged memory needed to display everything on a Logseq page).
- Open a local copy of the
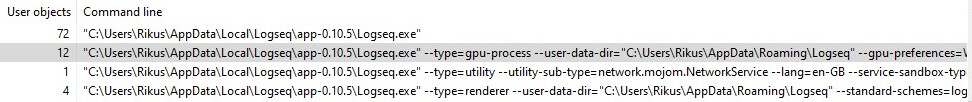
Advanced Queries.mdfile https://docs.logseq.com/#/page/advanced queries by using the latest stable Desktop Logseq (presently 0.10.5) on a 64bit Windows 10 system - Run taskmgr → Details tab → RMB columns → select User objects
- Find the Logseq process and monitor it to see if there is a correlation between the amount of User Objects and your performance issue
- Report back, because I am very curious to see if there is ;D
When developing a new app I double-check my big O() calculations by testing for minimum requirements on a barebone system with decreasing amounts of RAM. ^^ Logseq holds up pretty well on a system with only 4GB of RAM and a cheap onboard GPU installed ^^, which is below the minimum requirements for Windows 10 IIRC. I am not entirely sure how Electron checkboxes and Logseq TODOs are rendered or whether block bullets count as Objects per se; but at about 100 objects they do significantly reduce mouse update speed and overall performance, on a Windows 1022h2 test system with 4GB of RAM. I try to use physical (not virtual) machines for all tests, but since Windows 10 22H2 is mutable, this isn’t always possible.

My two cents.
I’m starting with logseq, and I have a page for a Glossary, so it has a lot lines and entries.
Recently, it started to annoying me because, every time i start to edit it, it refreshes.
I mean, I add a single character or delete a single character, and the page seems to save itself on the disk, and then reload and refresh it its display.
Many times, the cursor has moved another place, so other keys that I pressed are written in wrong place.
My use as glossary is:
Entry
- Description (this one is indented as child paragraph)
I started to fold all entries and it had better performance, stopped to save itself and stopped to refresh. It could be a hint what is happening.
1 Like