Is there a way to query for properties and display them in charts? Are there any plug-ins that can provide that? I found some, but none is really what i am looking for.
This would be huge to visualize and keep track of my book list or any sort of bucket list. There is aToDo Plugin that shows your progress on a progress bar and that is nice, but it is limited to the ToDo / Doing / Done mechanism.
Type:: book
Status:: read / unread / summarized
Etc.
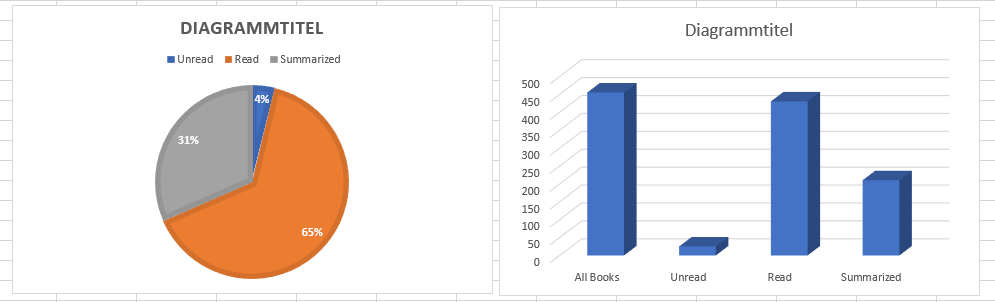
Would love to get something like i could get from excel:
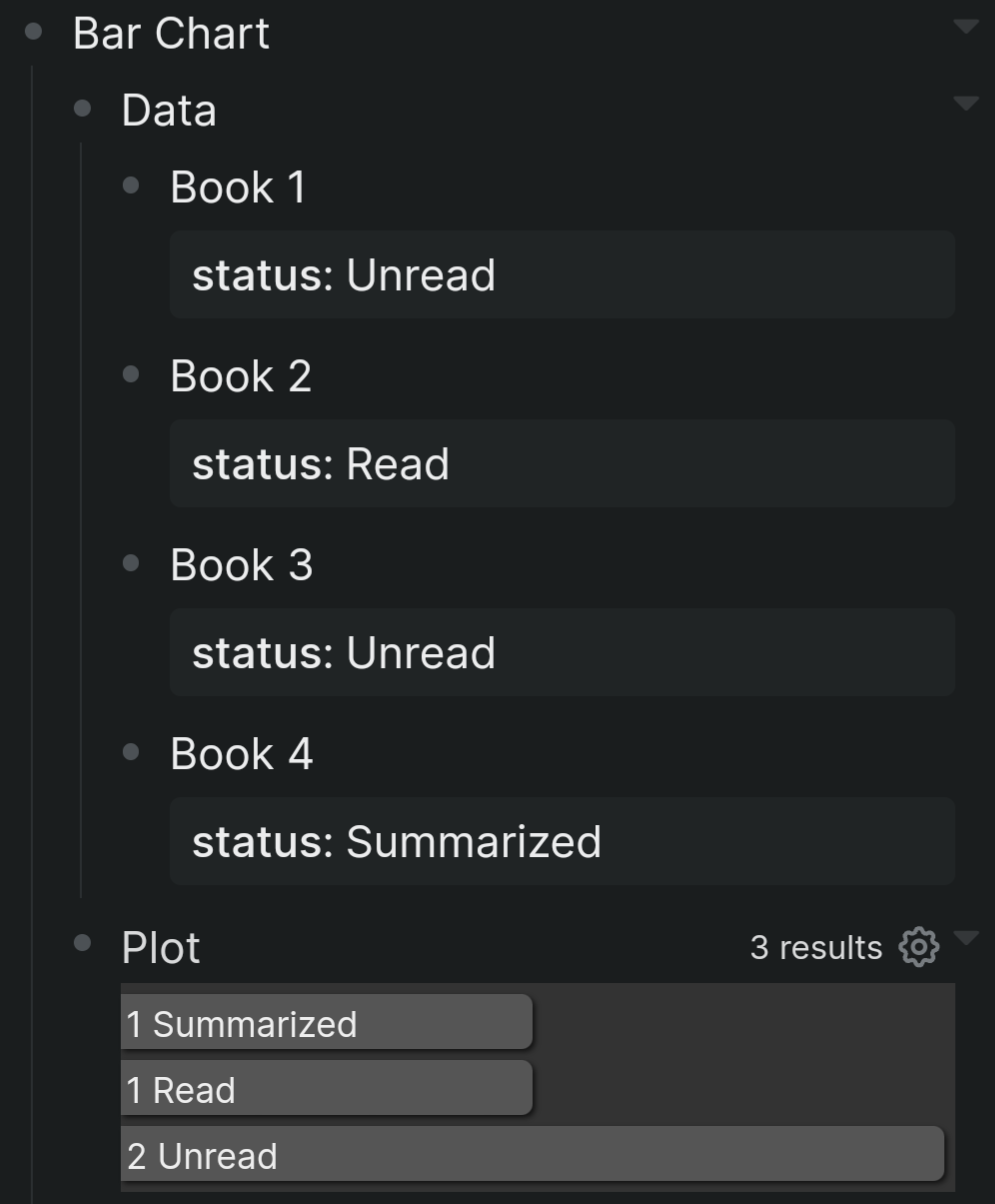
While not a plugin, it’s possible to use Advanced Queries to get the data you want, then present them as HTML inside Logseq using the query’s :view. A basic bar chart can be rendered this way, and has the advantage of working on mobile too.
Just wanted to let you know that i really appreciate the answers. I just haven´t had the time yet to try it myself. I will update my reply here as soon as i can add anything of value Thanks!
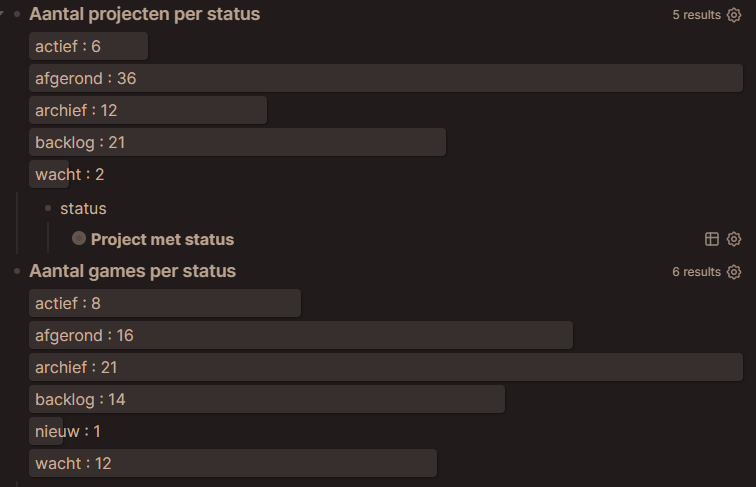
Now i try using the same column to show all the different kinds of media i have edited into my graph (books, paintings, blogs, videos, etc.). For this intend and purpose it works fine as well.
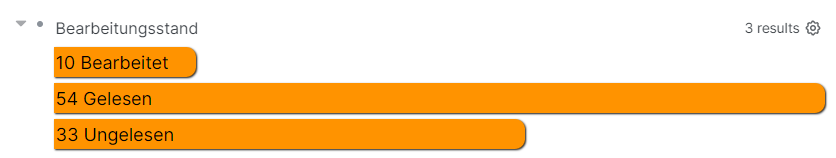
What i don´t like is that the words are not fully in the bar. I tried my best, but my skills are far to weak to tweak here.